
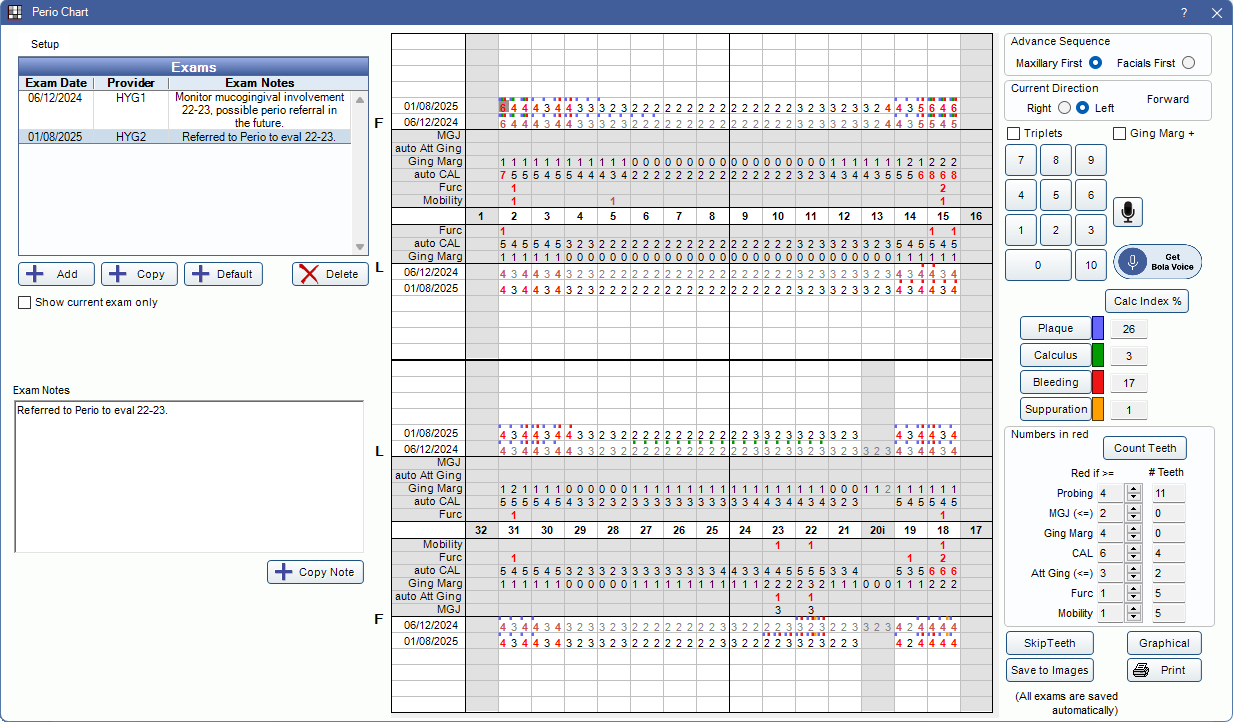
Perio Chart
Easily create and compare perio exams, including available voice perio features.
In the Chart Module, click Perio Chart.
![]() See our video: Perio Charting.
See our video: Perio Charting.
Exams
All exams are listed in this area and up to six of the most recent exams are displayed for comparison.
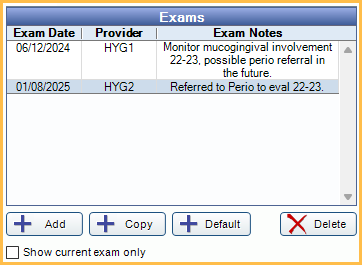
Add: Create a new blank perio exam.
Copy: Create a new copy, with today's date, of the most recent exam.
Default: Add a new perio exam with default measurements. Default measurements are customizable.
Delete: Delete the selected exam.
Show current exam only: Only show data for the currently selected exam.
Perio Chart
Data for the currently selected exam is shown in dark text. Data from up to five earlier exams is also displayed. Earlier exams are grayed out.
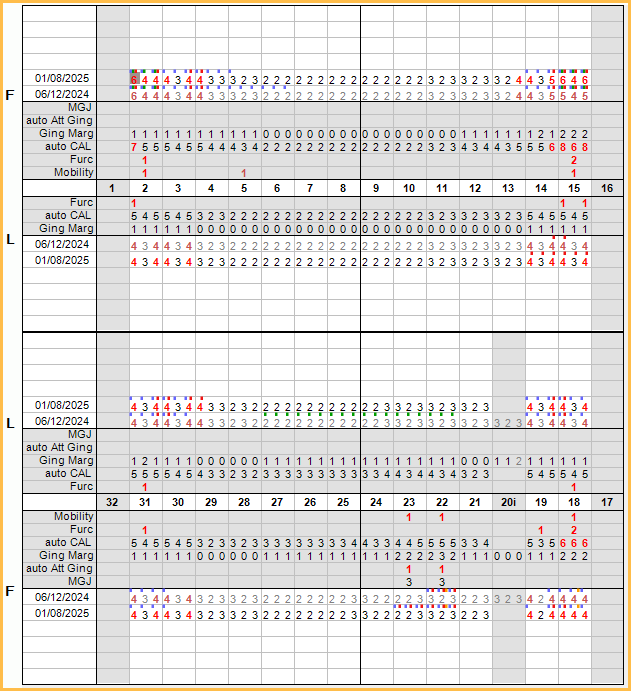
Enter data for probing depths, Mucogingival Junction, ginigival margin, furcation, and mobility. Clinical Attachment Loss is automatically calculated.
Entering Data
Enter data using the on-screen buttons, keyboard shortcuts, built-in voice perio, or Bola AI integration.
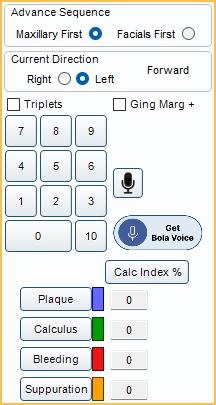
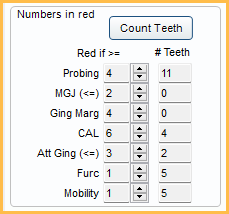
Numbers in Red
Easily see a count of teeth with flagged measurements (e.g., large probing depth). The measurements used can be customized.
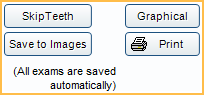
Additional Options
Use additional options to manually skip teeth (missing teeth are skipped automatially), save an image copy of the exam, view a graphical perio chart, or print a copy of the exam.
Graphical Perio Chart
In the Perio Chart, click Graphical.
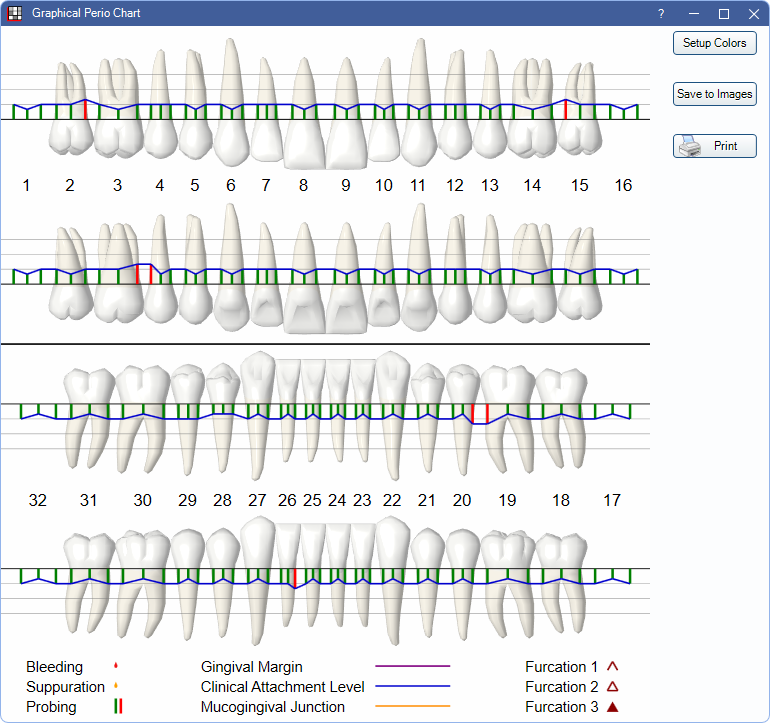
The graphical perio chart is a way to view a full screen 3D image of the patient's Perio Chart. This can be printed or saved to the Imaging Module. Chart colors are customizable.