Enhancing Radiograph Images
A raw image, such as a radiograph, may need to be adjusted to make it easier to see a specific feature such as caries or an abscess. This cannot be done with a film radiograph, and this is a major advantage of using digital radiographs.
This page discusses some of the terminology used when scanning or viewing digital radiographs. To scan radiographs, see the Imaging Module. To set default scanning values, see Imaging Quality.
Pixels
An image is made up of many pixels or dots. Each pixel can have a value between black (0) and white. The numeric value of white depends on the situation. If using 8-bit, white is 256, or for 12-bit, white is 4096. In the examples below, we use 1 as the value for white, with the various gray levels between 0 and 1.
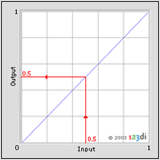
Below is a graph representing no enhancement. The x axis represents the color (gray level) of each pixel input from the raw image, and the y axis represents the resulting output in the enhanced image. For any value that is input, the exact same value is output. The red shows how an input of .5 results in an output of .5. This graph is the basis against which all enhancements are compared.

Contrast and Brightness
Contrast is the steepness of the line; the steeper the line, the more contrast. Brightness is represented by a horizontal shift in the line without changing the contrast.
Gamma
Gamma is not used by Open Dental. It can describe a curve in the line with an exponent and is used for non-linear situations. It was more important when CRT monitors were used.
Windowing
Windowing is an alternative to contrast and brightness that is very useful for images like radiographs.

This is the Open Dental slider control that lets the user set the windowing values:
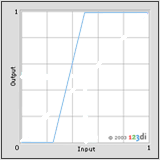
The line is steeper (more contrast) over a specific range of input values. This results in a smaller window of values which are spread into the output so they can be seen more easily. A window has a lower bound and an upper bound. All input values below the lower bound are output as black, and all values above the upper bound are output as white. Moving the sliders left and right isolates the gray levels of interest. The slider should affect the entire image in real time for it to be useful.
Histogram
A histogram is a count of how many pixels are in the image for each grayscale level. This is frequently shown in imaging software as a small bar graph. Open Dental internally uses histograms for certain algorithms such as conversion from 12 bit to 8 bit, but there is not currently a histogram tool for viewing the values in a graph. Some software does automatic contrast and brightness adjustment. One technique is Contrast Limited Adaptive Histogram Equalization. If the image is too dark or too light, then this technique shifts the pixels towards a more neutral shade. If there is not enough contrast, the shades are spread out, similar to windowing But it's all automated and based on localized regions of the image rather than just treating the image as a whole. This technique is used by Schick and a few others. It is not currently used by Open Dental.

